 In an earlier article, we looked at how to create a dashboard based on some sales data. The data source for that example was several tables in a SQL database. In this article, we’re going to look in more detail at the data model we built in that Power BI example, and specifically the use of fact and dimension tables.
Fact Table vs Dimension Table: What’s the difference?
Other than for simple databases, we need to organize our data into separate tables. The main reason to do this is performance-related, but it also makes it easier to maintain and scale the database. This process is called data modeling.
A common data modeling approach is to use a star schema with fact and dimension tables. The example below shows sales data modeled with a fact table at the center, and dimension tables related to it in a rough star shape. This approach is also an example of data normalization. When data is normalized it exists in one and only one source-of-truth location. Denormalized data, on the other hand, exists in multiple summarized locations.
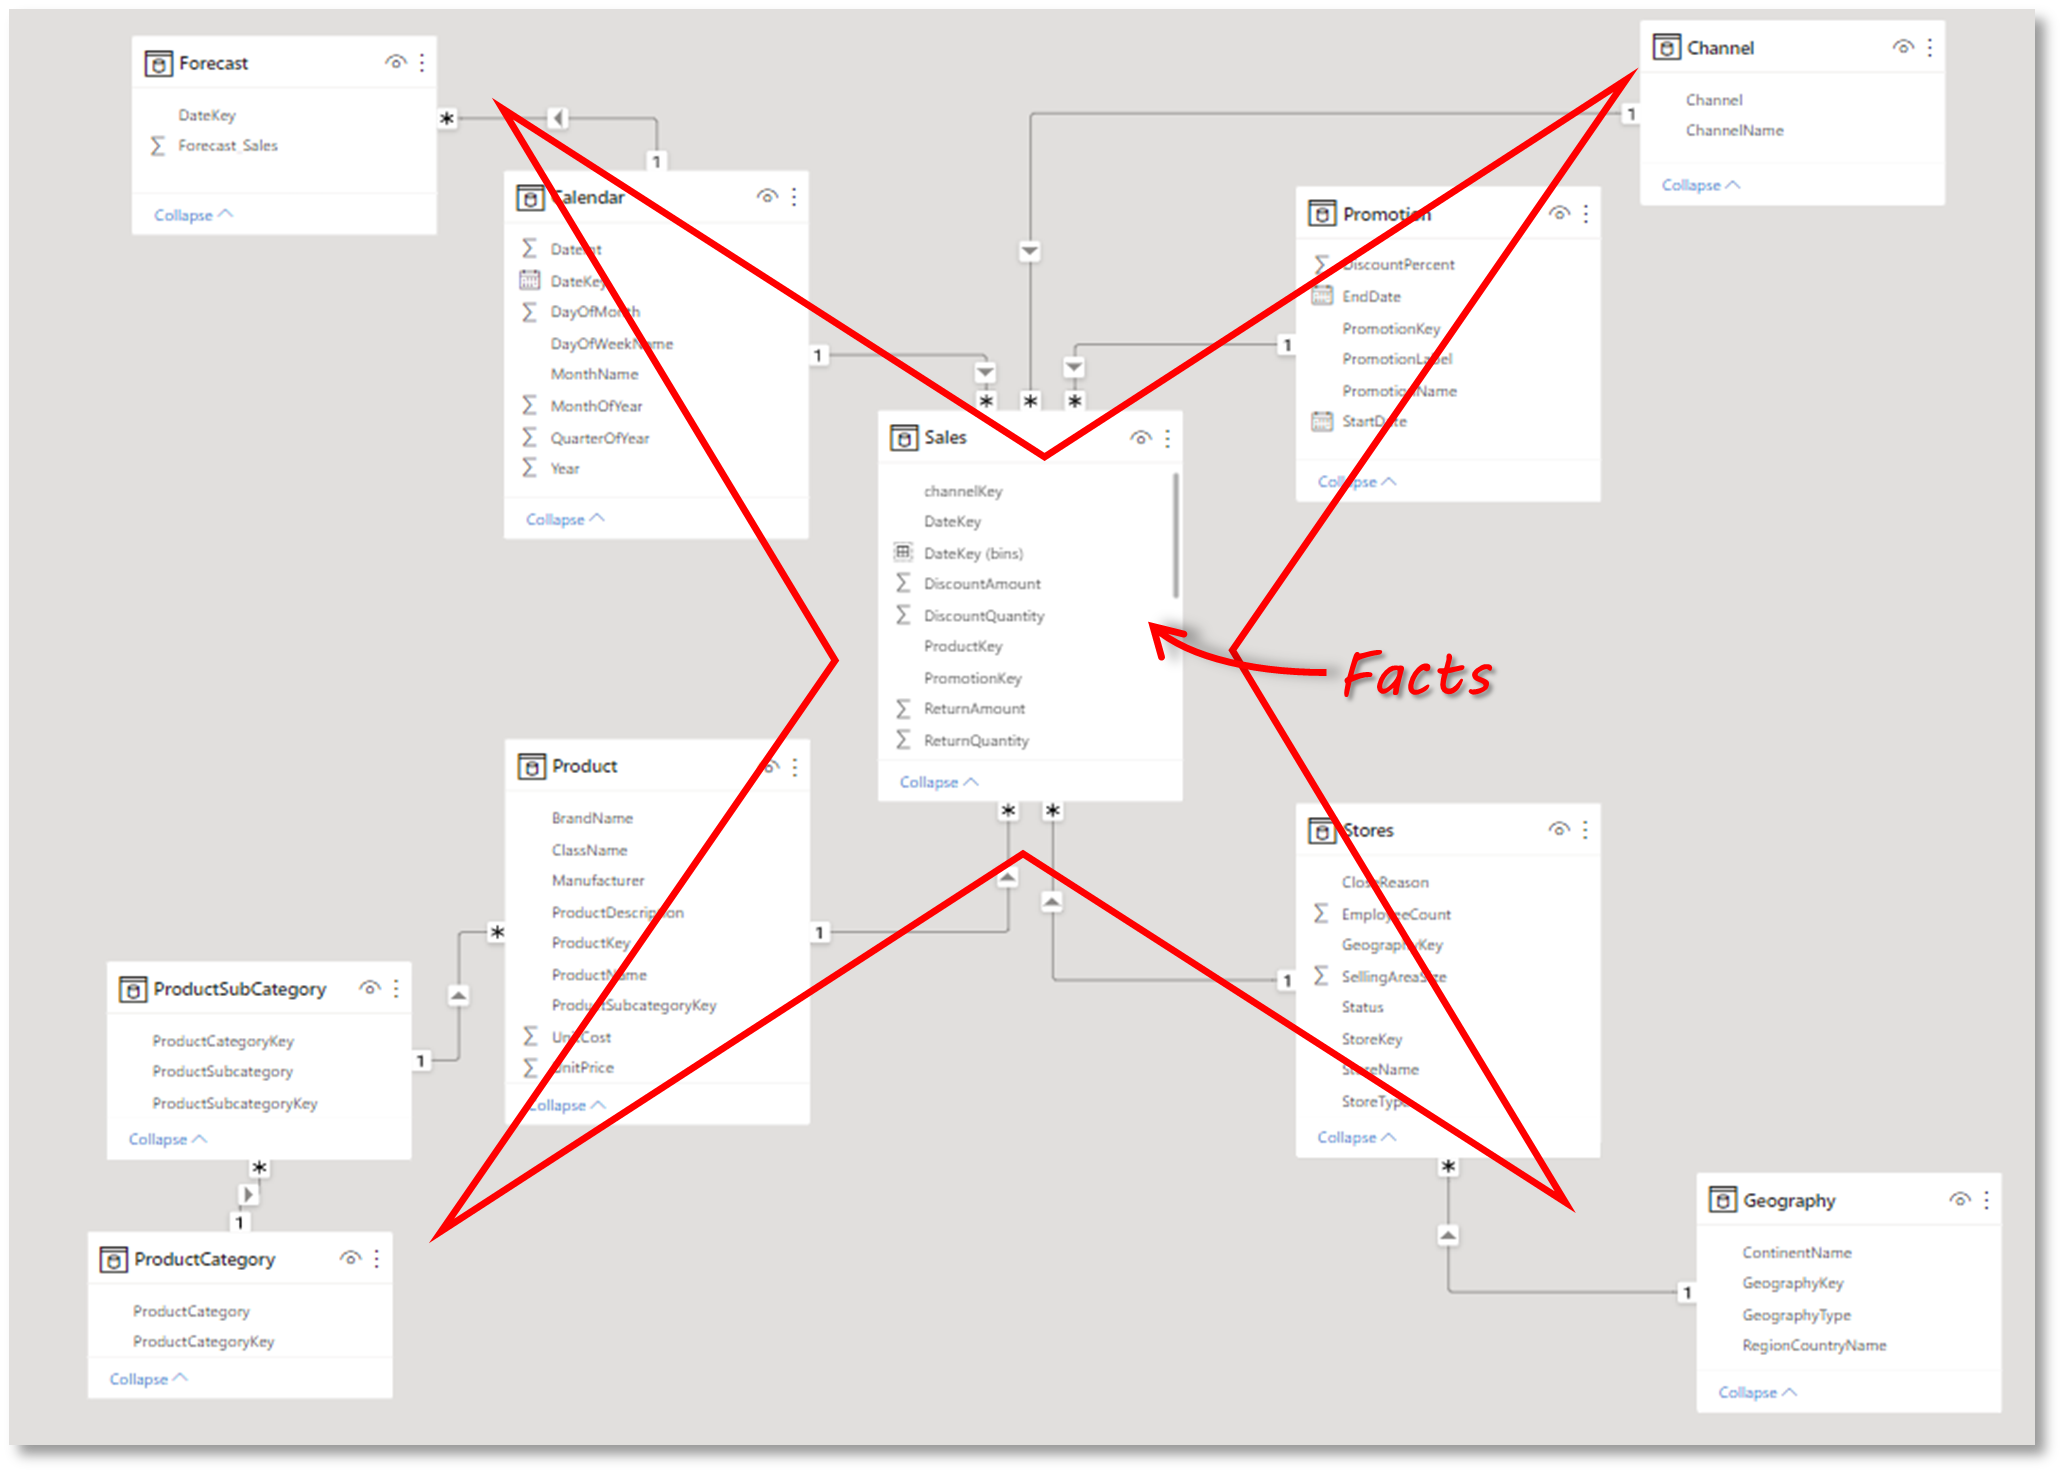
This form of data model is quite intuitive. In this example, the actual values that we are interested in are the transactions in the Sales table; the quantity sold, cost, price, etc – these are the facts. We can then further describe and categorize these facts using dimensions, such as product details, category, store location, channel.
The table below summarizes the main differences:
| Characteristic | Fact Table | Dimension Table |
|---|---|---|
| Basic Definition | It contains data (often transactional) that you want to analyze | It accompanies the fact table and stores information that describe records in the fact table |
| Purpose | It contains measures and is used for analysis and decision making | It contains information about a business and its process |
| Type of Data | Numeric and textual format | Textual format |
| Primary/Foreign Key | A primary key for each dimension which is acts as a foreign key in the dimension table | A foreign key associated with the primary key of the fact table |
| Hierarchy | No hierarchy | Contains a hierarchy |
| Attributes | Less attributes | More attributes |
| Records | More records | Less records |
| Table Growth | Grows vertically | Grows horizontally |
| Data Model | Fewer fact tables in the data model | More dimension tables in a data model |
| Update frequency | Records added very frequently | Records not added frequently |
Fact Tables
Fact tables contain the data that we want to analyze. The data is usually transactional in nature. A fact table also needs to include the keys to the related dimensions. In our sales data example, the Sales table is a fact table that contains keys to the related dimension tables:
- SalesKey
- DateKey
- ChannelKey
- StoreKey
- ProductKey
- PromotionKey
- UnitCost
- UnitPrice
- SalesQuantity
- ReturnQuantity
- ReturnAmount
- DiscountQuantity
- DiscountAmount
- TotalCost
- SalesAmount
As you can see there is a key column to provide the relationship to each of the dimension tables.
Dimension Tables
Dimension tables provide the information to help us describe, categorize, group, or filter the data in the fact tables. You would normally have a different dimension table for each way that you want to analyze or report on your fact data.
In our sales data example, the following dimension tables are in the database:
- Product: contains name, brand, manufacturer, cost price, sales price, etc
- Product Category: contains category
- Product Sub Category: contains a level below the product category
- Stores: contains name, type, city, employee count, size, etc
- Geography: contains geographical information related to store location
- Channel: contains channel type
- Calendar: contains standard reporting time periods, such as days, months, quarters, years
As you can see, these all represent useful ways in which we can analyze the data in the Sales table.
Data Model in Power BI: Fact and Dimension Tables
Let’s go back to the earlier example in Power BI. In the step-by-step instruction, the second step was to check the data model once we’d created the connection to our data source (SQL Server) and imported the data. In the process of importing the data from the data source, Power BI attempts to identify the relationships in the tables.
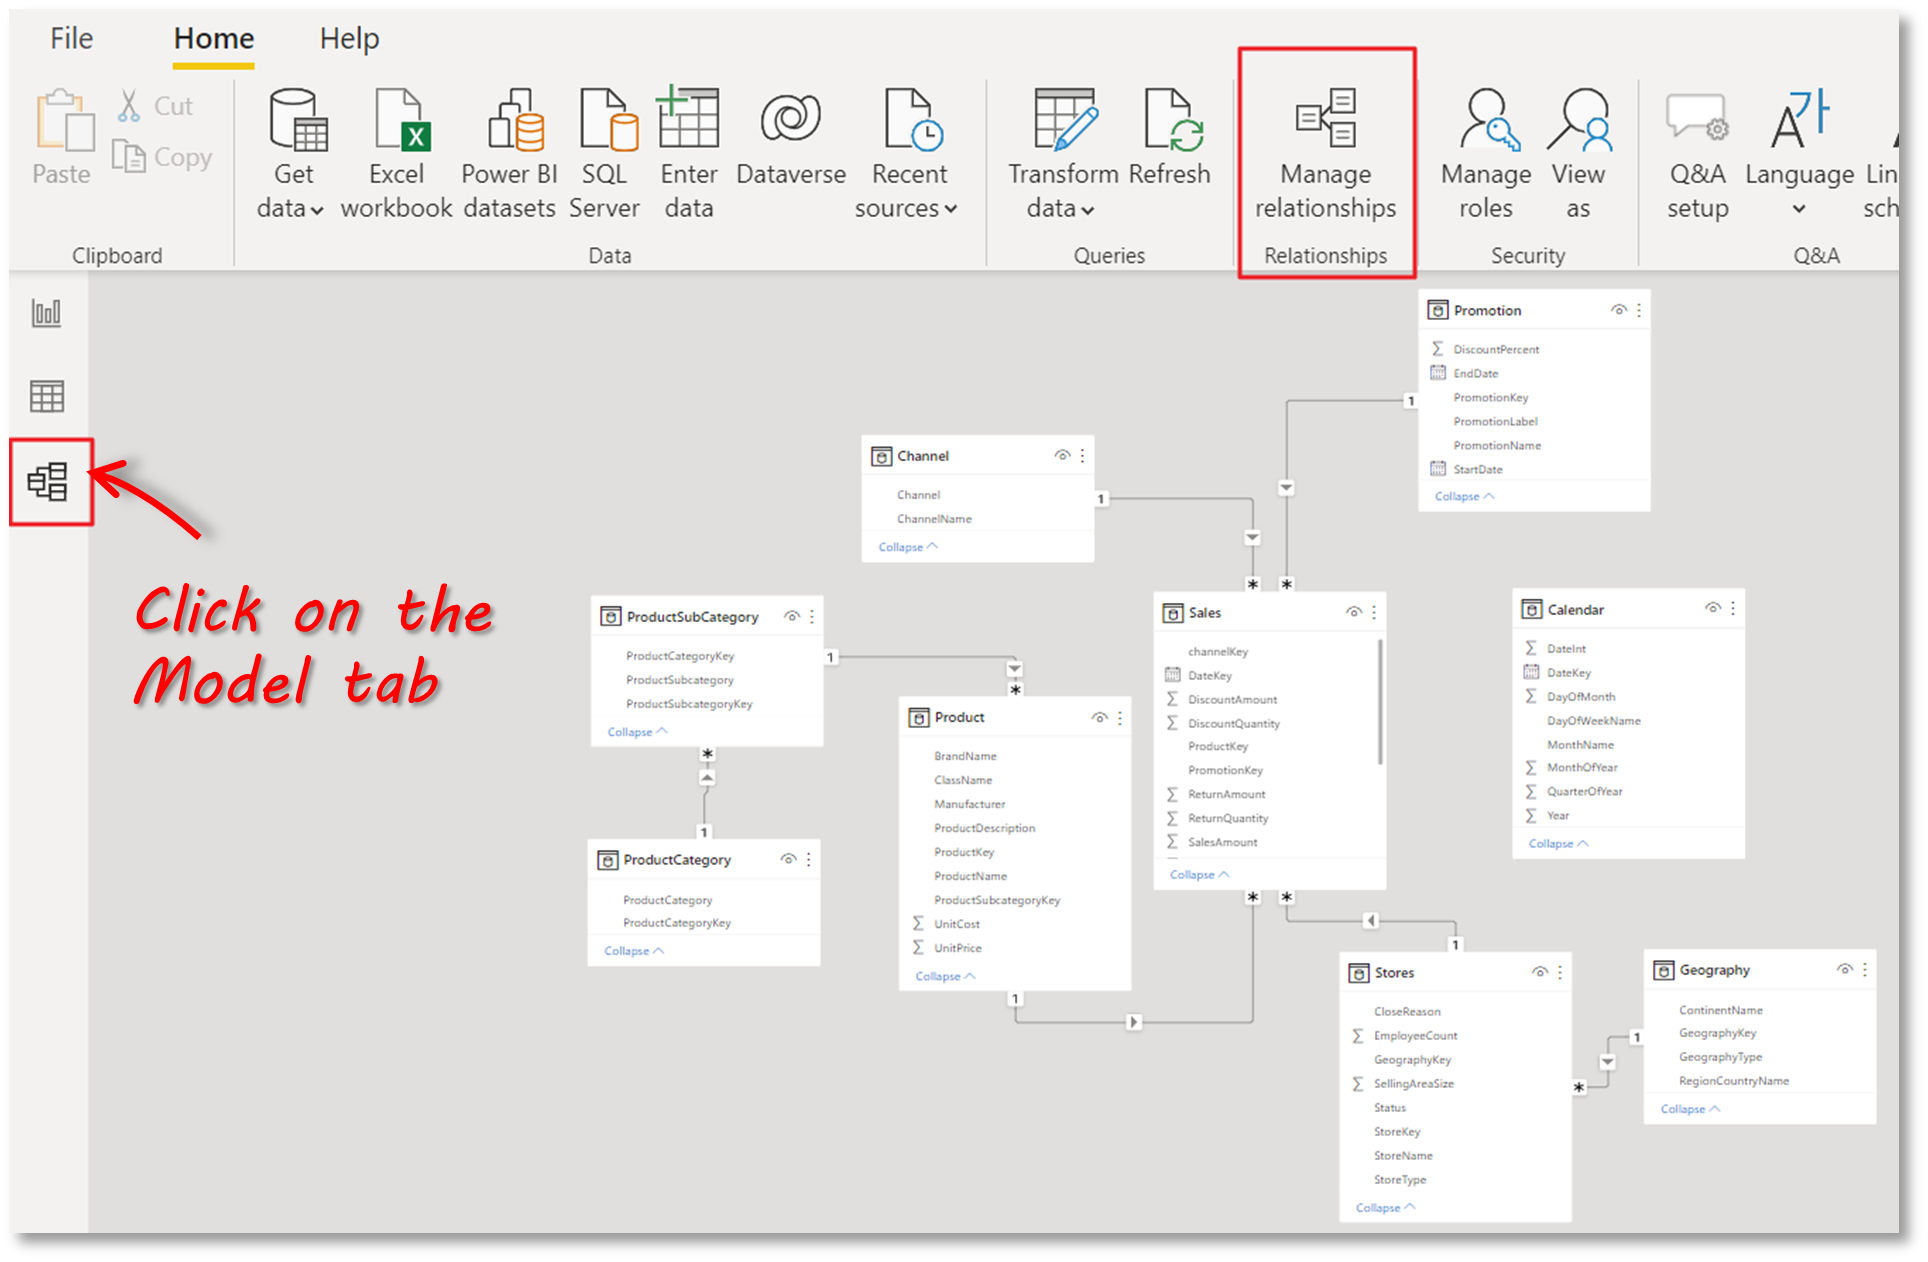
It’s important that we check the relationships that Power BI has automatically created (in case some are incorrect). To do this, click on the Model tab in Power BI and then Manage relationships.
In the Edit relationship dialog, we can select the tables that we want to create the relationship between. For example, in the screenshot below, the Sales table is being related to the Calendar table through a many to one relationship.
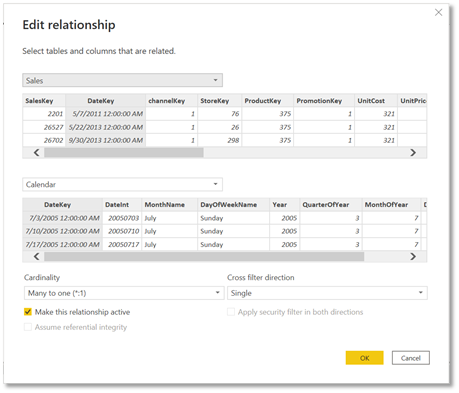
Once the relationships have been checked and completed, the data model in Power BI is ready, and we can take advantage of the relationships when we create visualizations and custom measurements. If we don’t explicitly create these relationships in the data model, we are likely to see some inconsistent results in the reports we create.
Update and manage the data and attributes in your dimension tables
In the comparison between fact and dimension tables, we saw that records are added to the fact table(s) very frequently. In our example, we can assume that the records in the Sales table are added by Point of Sales or an ordering system in real-time.
What about the dimension tables? They are generally not updated very frequently, and this would typically be a manual process. However, due to the importance of the dimension tables and the role they place in our data model, it’s critical that there is a simple and robust method for updating this data. For example, we wouldn’t want to accidentally add a duplicate record to our Stores or Product Category table, as it will skew the results and mess up our reporting.
Due to the importance of the data, dimension tables are often considered part of an organization’s Master Data. Master Data Management can become a complex undertaking as organizations grow, requiring major effort to implement. However, for many organizations, a simple, but controlled way to update records in tables in a SQL database is sufficient. One way of doing this is with SQL Spreads.
Update dimension tables with SQL Spreads
SQL Spreads is an Add-In for Excel that makes it easy to manage data in SQL Server. With SQL Spreads you can create new tables or update existing ones in SQL Server, which, together with features like data validation would make it a good option for managing dimension tables.
Install the SQL Spreads Add-In for Excel
You can download a free trial of SQL Spreads from here.
- Run the SQLSpreadsSetup.exe file and follow the instructions.
- Restart Excel and accept the Add-In confirmation.
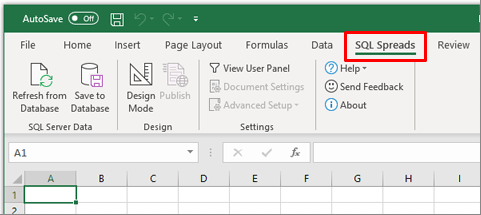
- You will find SQL Spreads in the tab menu in Excel:

For more details about installation, check out the Installing SQL Spreads section of our Knowledgebase.
Connect to your database and insert data from Excel
Once SQL Spreads is installed, you’ll see that it has been added as a new ribbon tab.
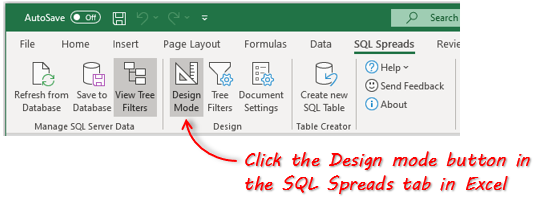
- Click on SQL Spreads and then click the Design Mode button

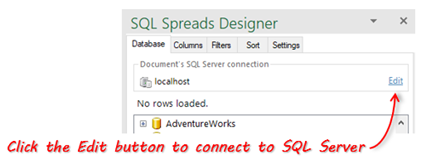
- In the SQL Spreads Designer panel on the right side, click the Edit button to open the SQL Server connection dialog.

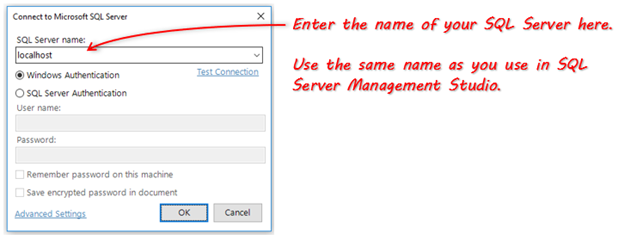
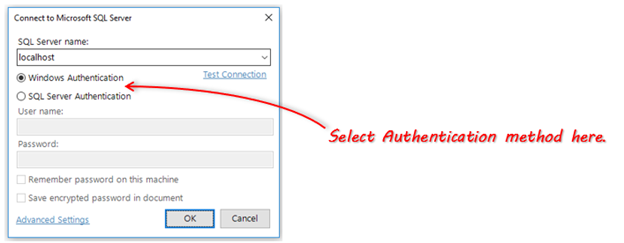
- Enter the name of your SQL Server into the SQL Server name field:

- Select if you should connect using your Windows-login (Windows Authentication) or enter a user name and password (SQL Server Authentication). Windows authentication is the more secure of the two options.

- Click OK. SQL Spreads will try to connect to the database. If the connection is successful, your databases will show up in the SQL Spreads Designer panel.

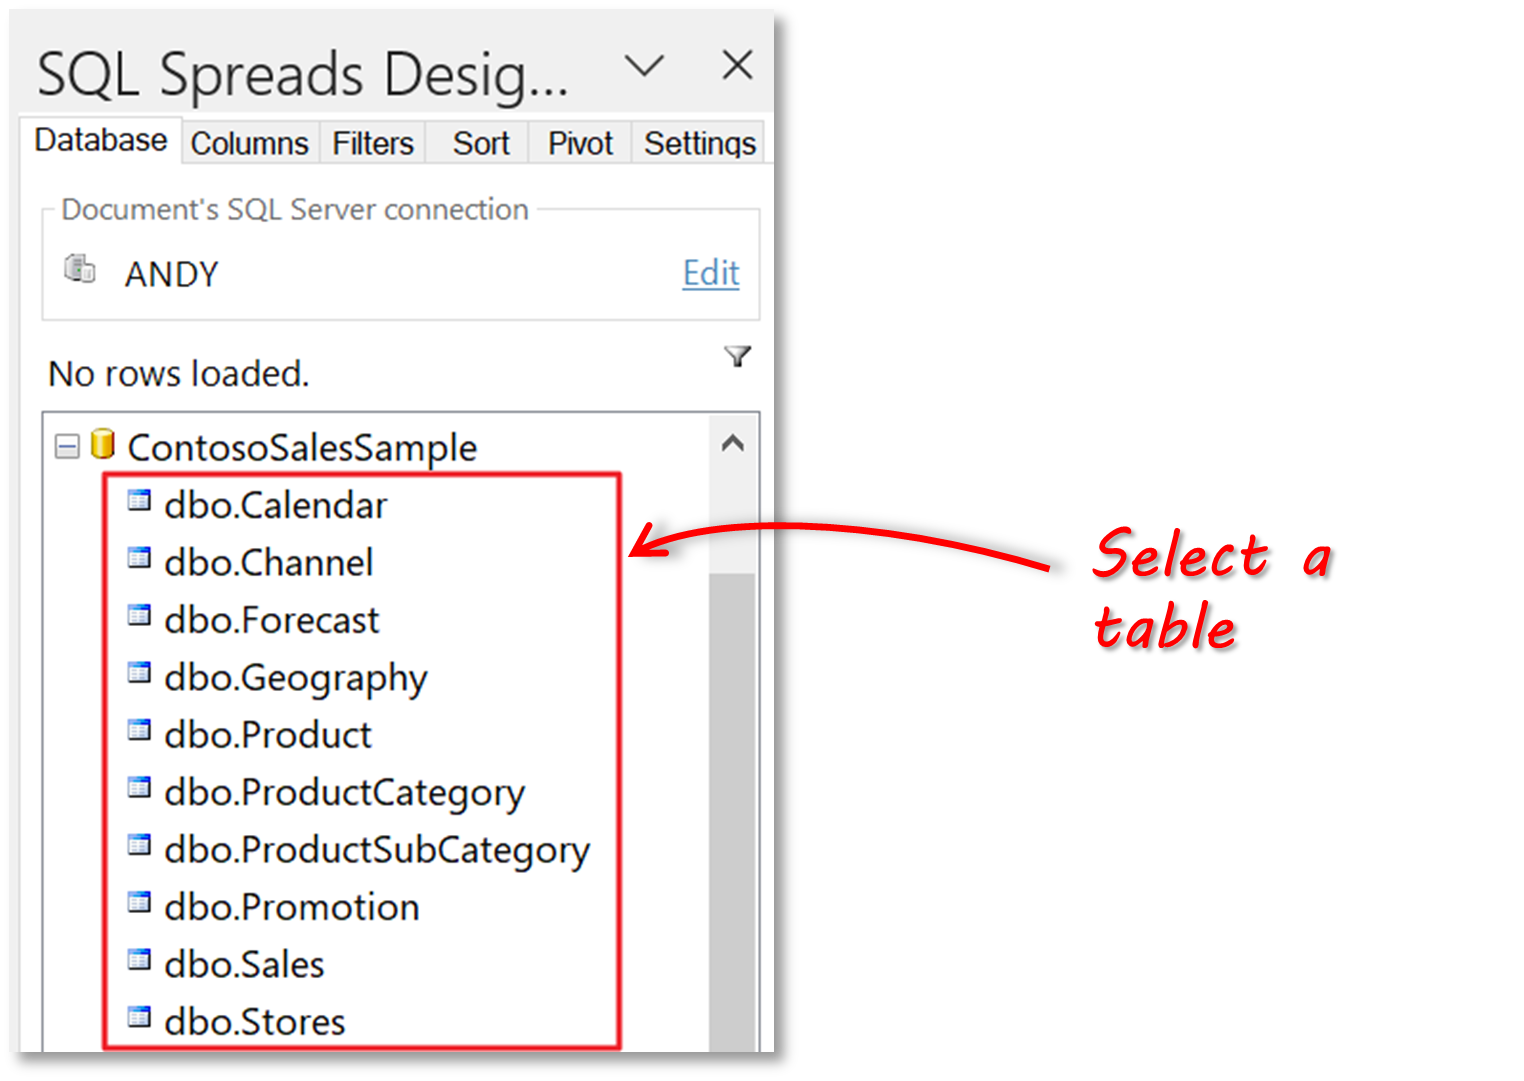
- Now that we’ve created the connection from Excel to SQL Server, we can select which table of data we want to use in Excel. In the SQL Spreads Designer, click on the database and then select your table.

As soon as you select a table, the data in the table is populated in the Excel sheet. The real power with SQL Spreads is the ability to update or add to the data in SQL Server direct from Excel.
Updating Data
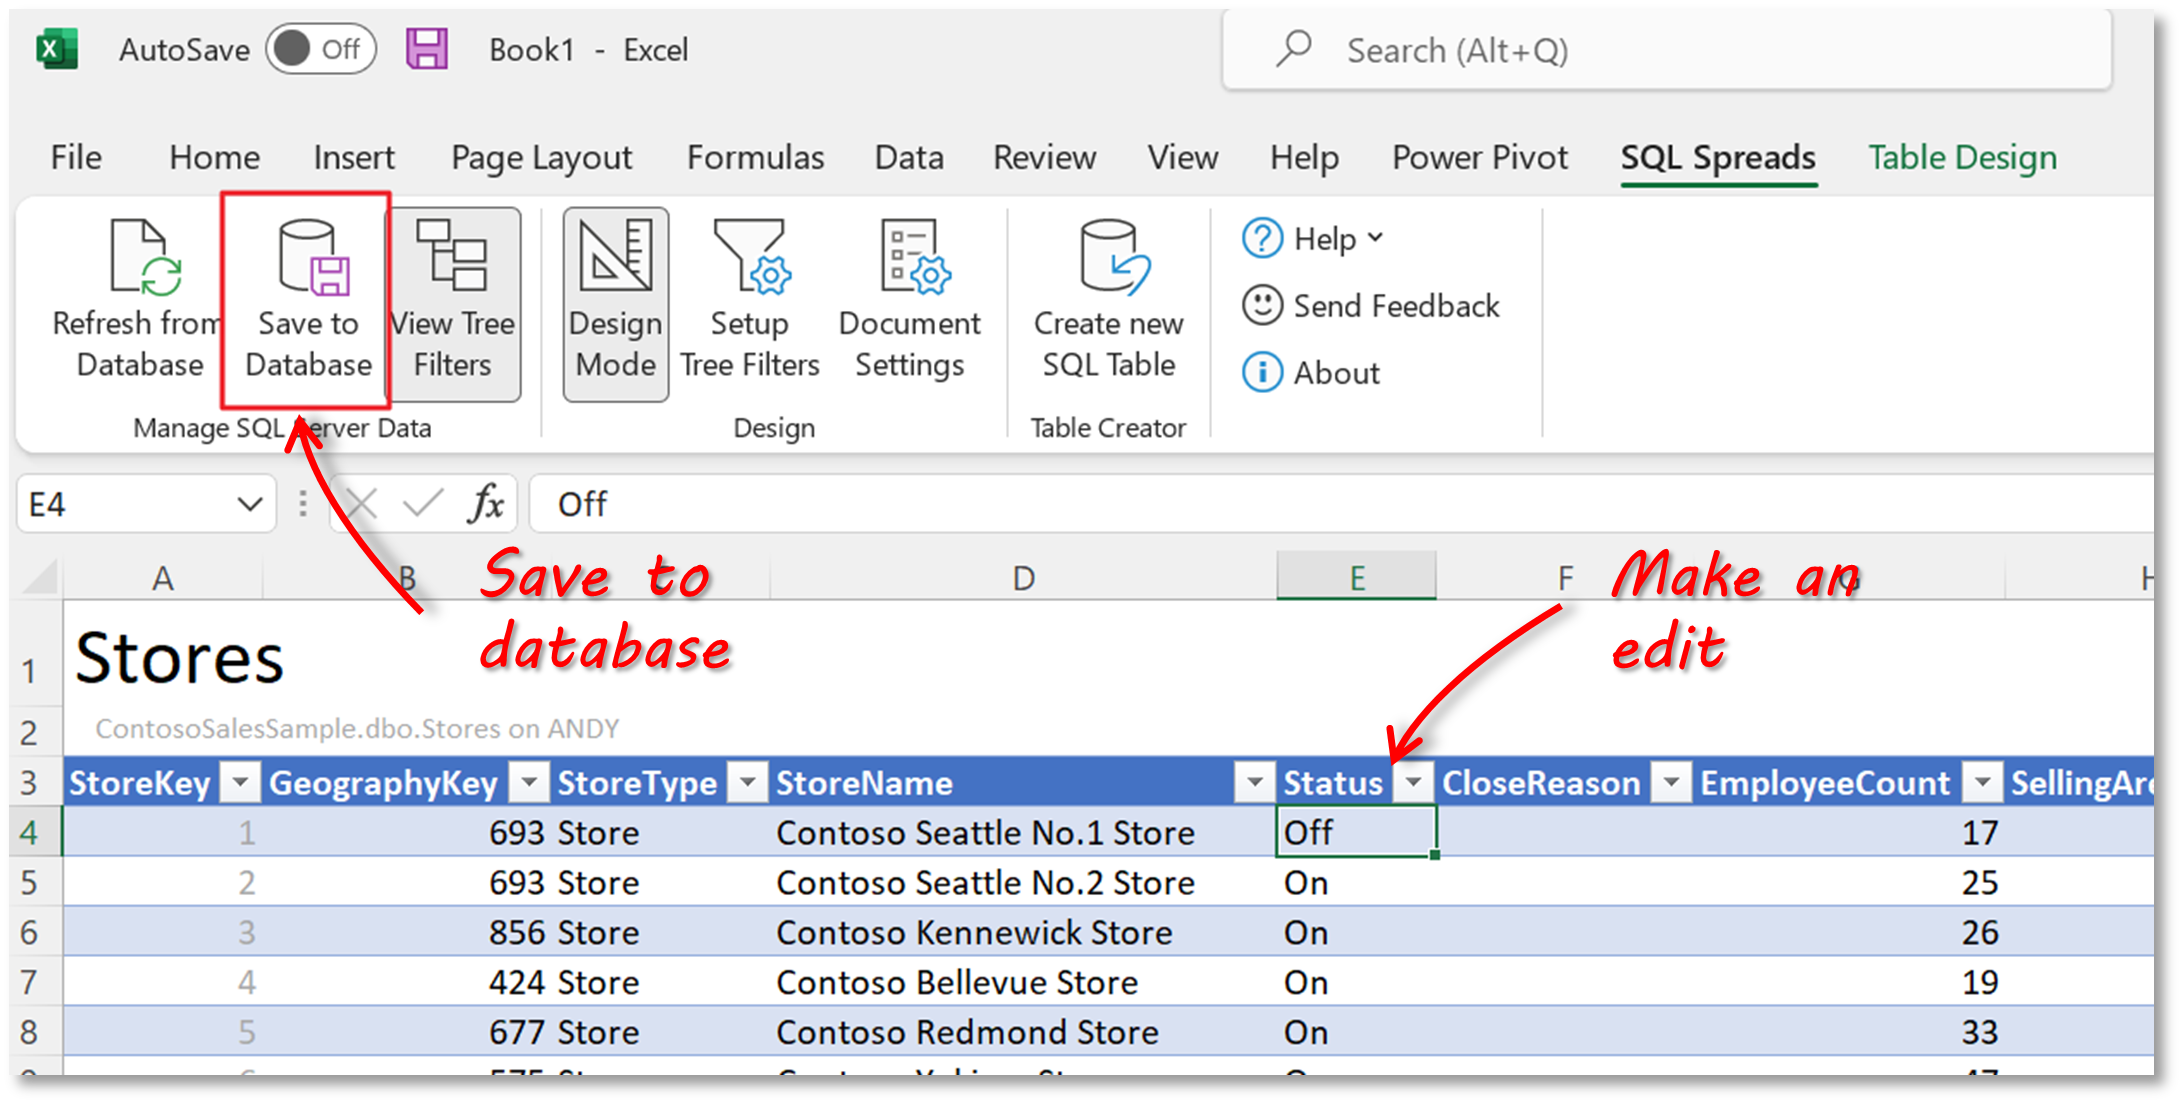
For example, I can update the stores in the Stores table directly in Excel and save the changes back to SQL Server. To do this I simply make the edits in the table in Excel and then click on the ‘Save to Database’ button to get the changes written to the table in SQL Server.
Inserting New Rows
To add new rows to a dimension table, scroll down to the first empty row and either type in your new data or paste a set of rows copied from another Excel workbook:
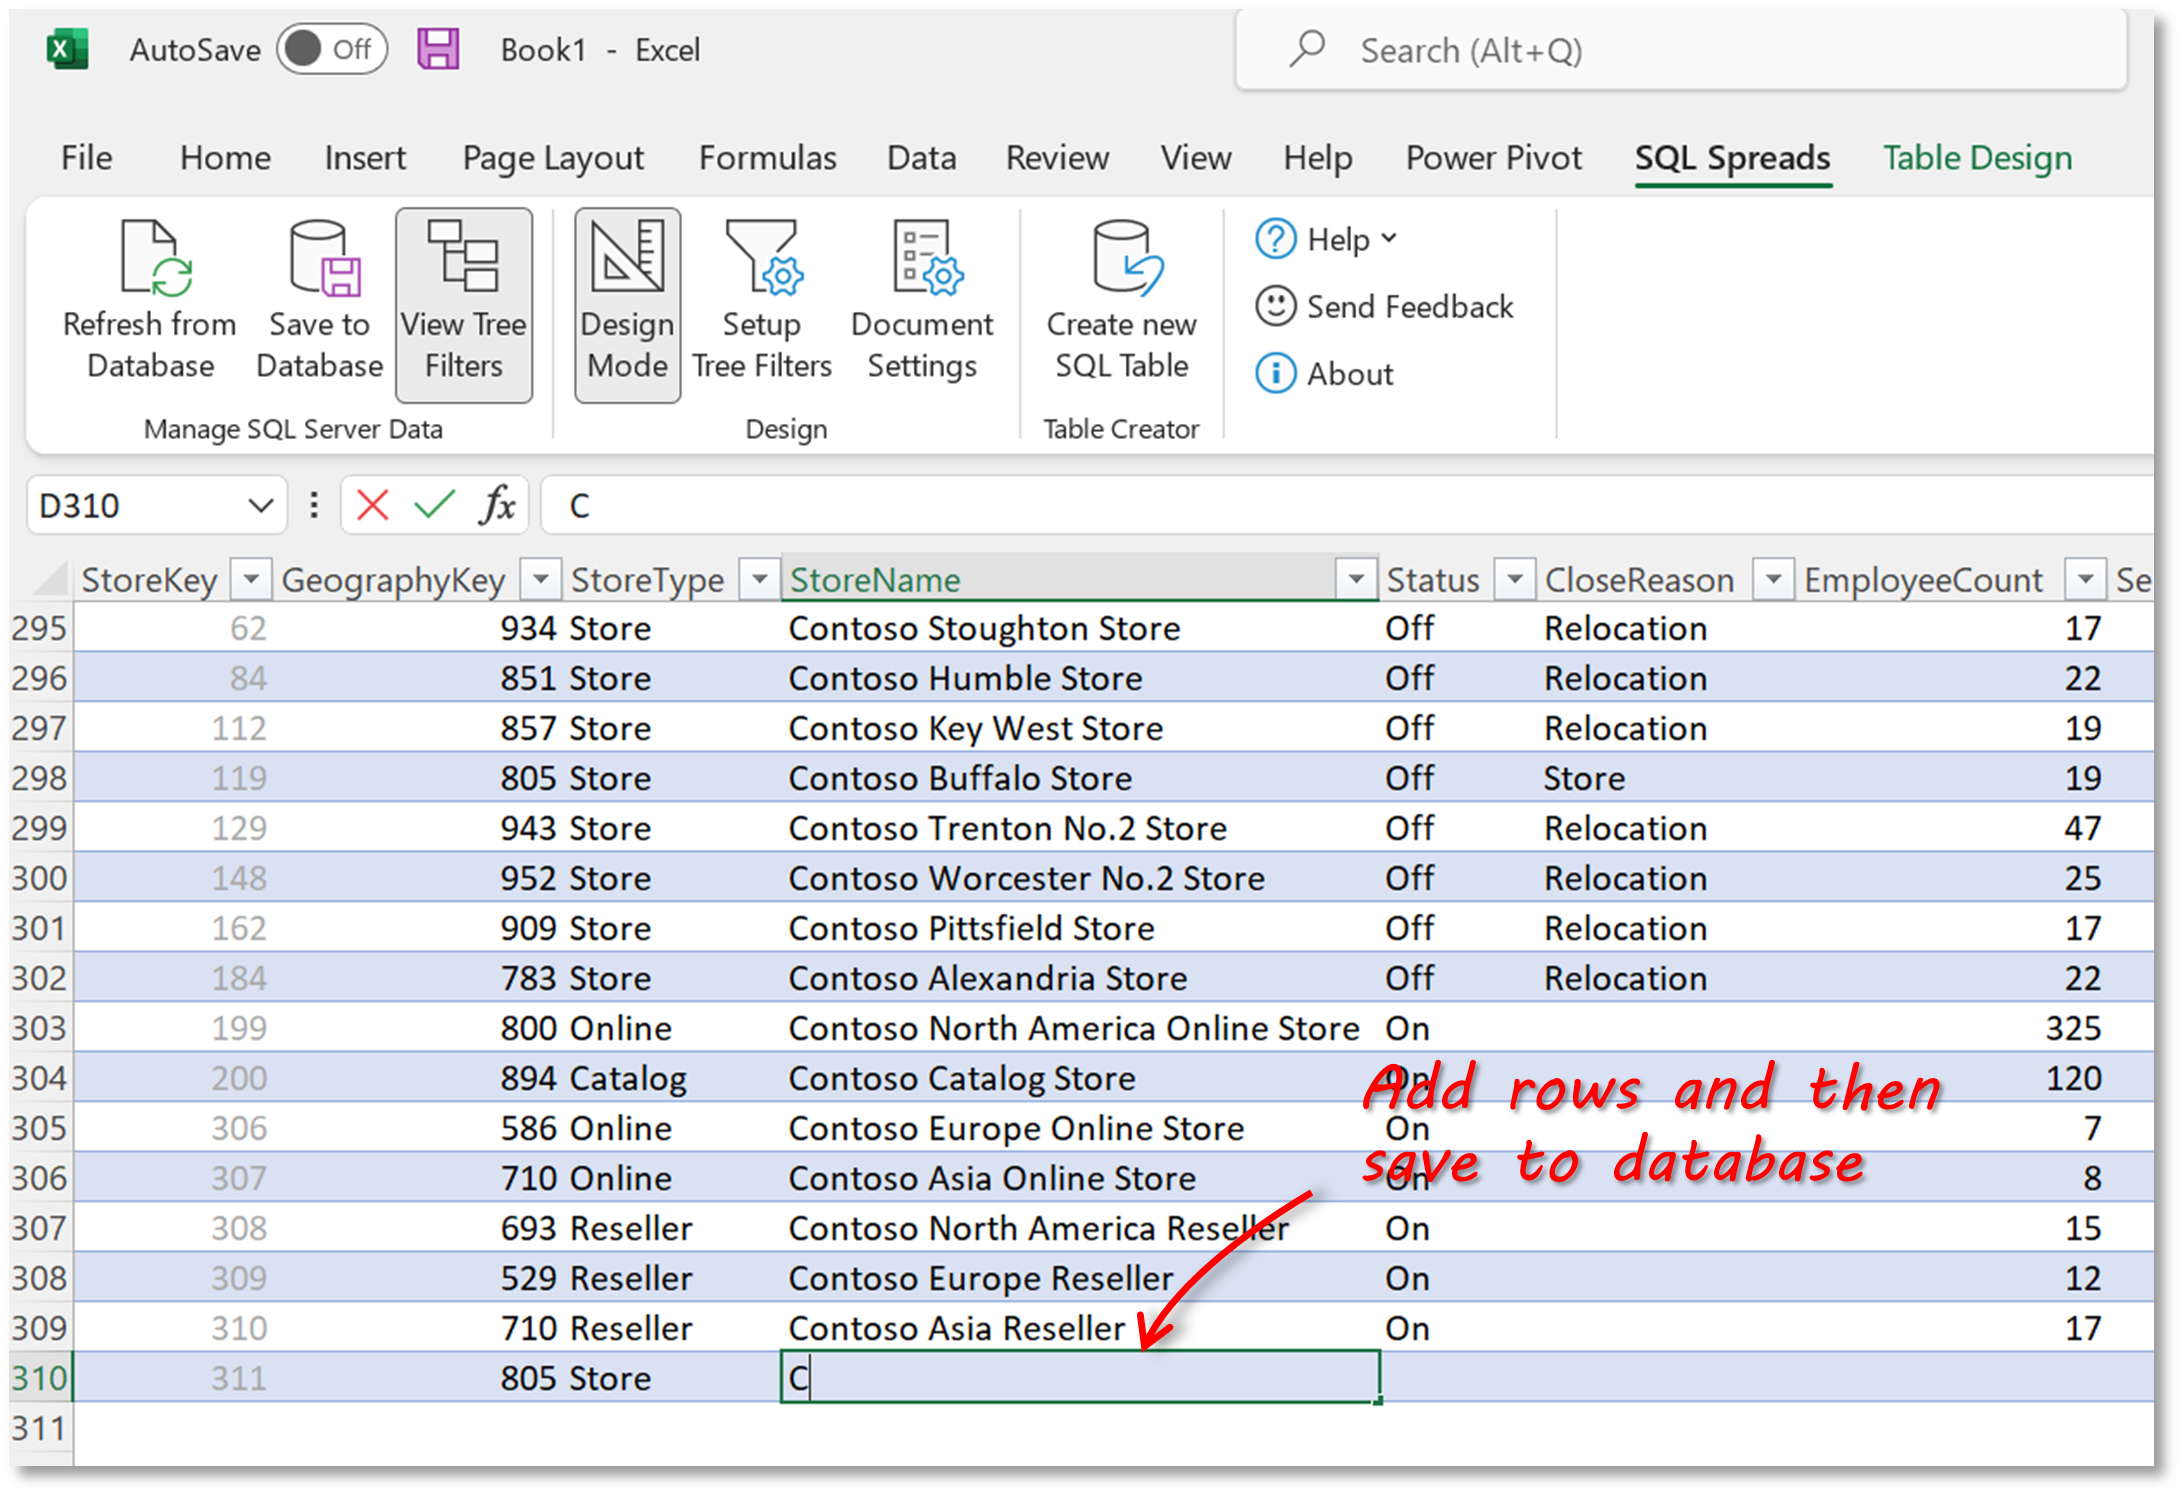
Once you’ve added or pasted the new rows, click the ‘Save to Database’ button to get the changes written to the table in SQL Server.
Refresh Data in Power BI
After making changes to the dimension tables in SQL Server, we would then need to go back to Power BI and manually refresh the data so that the changes are reflected in our reports.
Summary
In this article we’ve talked about fact and dimension tables and why they’re important in data modeling, particularly when creating reports or aggregates in Power BI.
A fact table contains the values for the actual data that we want to analyze and report on – sales transactions (quantities sold, costs, and prices) is a classic example of data in a fact table.
A dimension table contains information to provide descriptions to help categorize/group/filter the transaction data in the fact table.
Finally, we showed you a way to make updates to the dimension table in SQL Server using the SQL Spreads Add-in for Excel. Download a free trial here, or contact us if you have any questions on the benefits of using SQL Spreads to manage your SQL data.




Leave a Reply
No comments yet. Be the first!